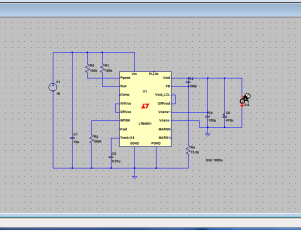
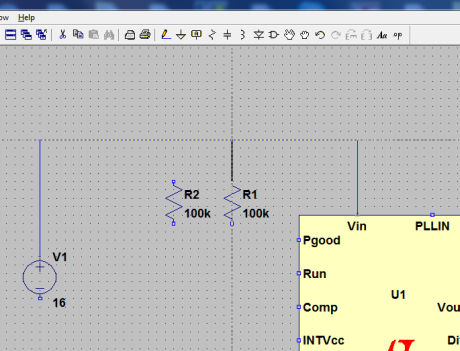
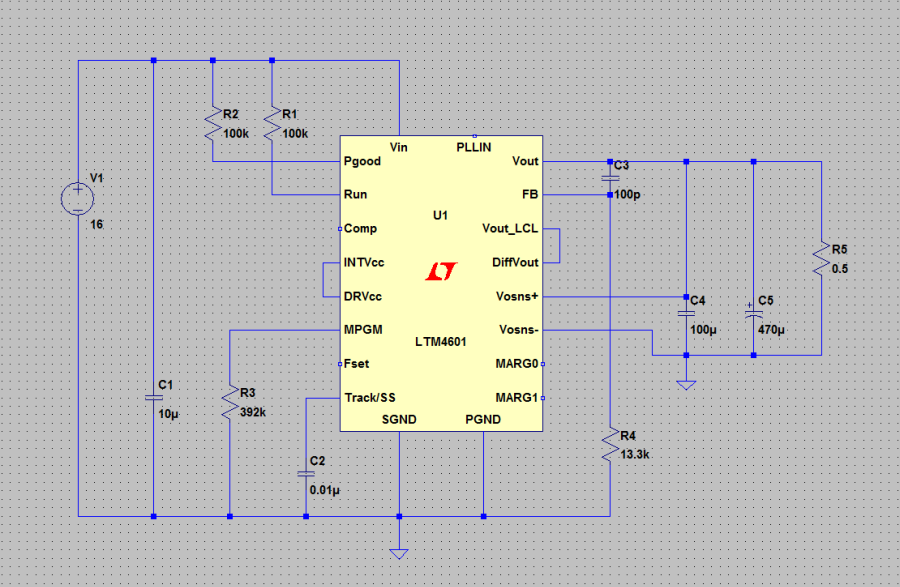
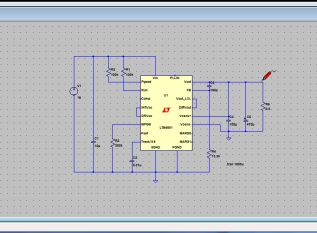
Select the pencil icon from the toolbar to begin wiring the circuit. This tool allows you to draw connections between the components in your schematic.

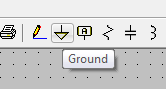
Choose the ground reference point and use it to complete the schematic by connecting all the components to create a closed circuit. This establishes the ground reference for your circuit.
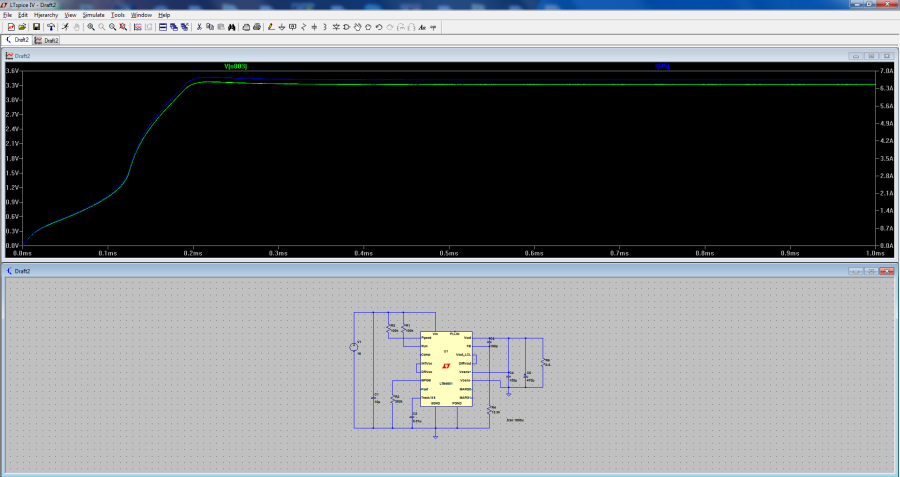
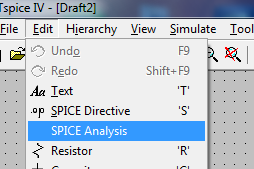
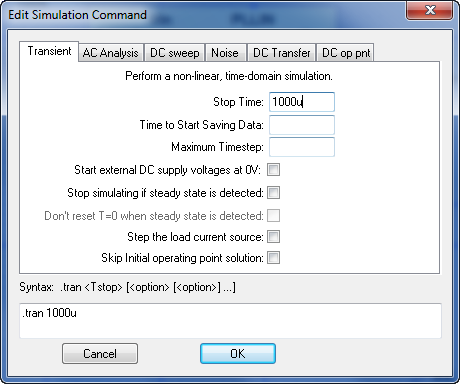
From the “Edit” menu, select “SPICE Analysis,” and then set the “Stop Time” to 1000 microseconds (usec). After configuring the analysis settings, click “Run” to execute the simulation.
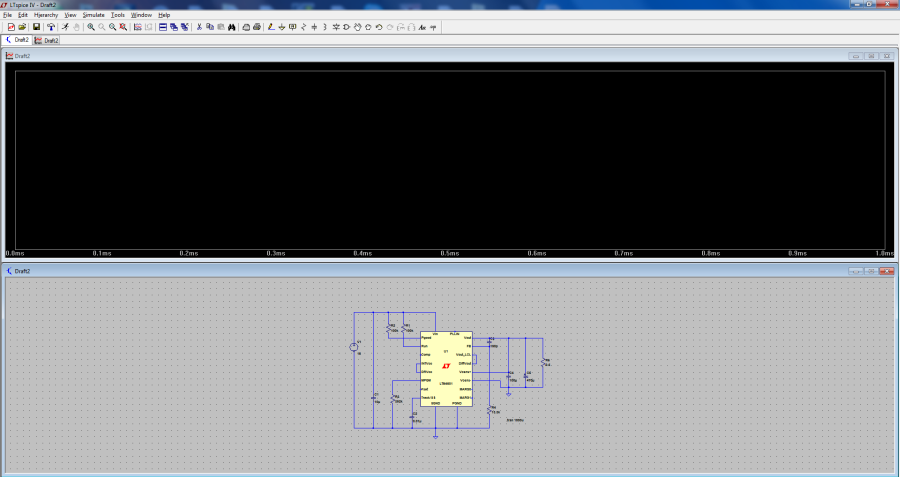
To trace the output voltage, locate the node or component that represents the output in your schematic. Then, move your mouse over that node, and a voltage probe should appear. Click the left mouse button on the voltage probe to view the output voltage waveform in the plot window.
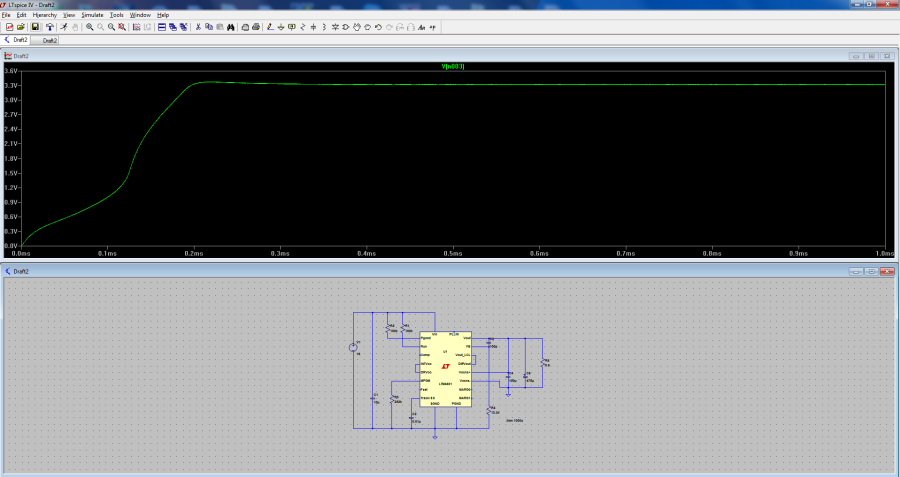
To trace the output current, locate the component that represents the output current in your schematic. Move your mouse over that component, and a current probe should appear. Click the left mouse button on the current probe to view the output current waveform in the plot window.