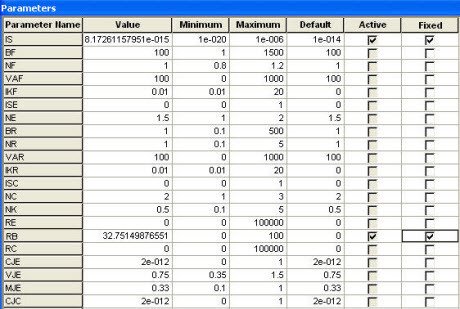
From this first curve we find IS and RB:

We obtain IS= 8.172 fA and RB=32.751,then we set these values and continue:

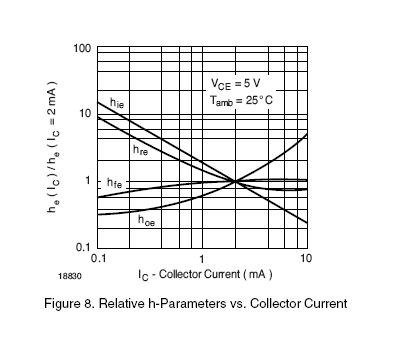
In the next graph, we must report the so-called output admittance:

After entering the data we obtain the graphic:

From this first curve we find IS and RB:

We obtain IS= 8.172 fA and RB=32.751,then we set these values and continue:

In the next graph, we must report the so-called output admittance:

After entering the data we obtain the graphic:
