Let’s now explain how to configure Proteus VSM to work with the Keil IDE. The interaction between Proteus and Keil C is achieved through the Virtual Debug Monitor (VDM) interface. If Keil C and Proteus are correctly installed, follow these steps:
- Copy the ‘VDM51.dll’ file from, for example, ‘C:\Program Files\Labcenter Electronics\Proteus X Professional\MODELS\VDM51.dll,’ to the ‘C:\Program Files\keil\C51\BIN’ directory.
- Use Notepad to edit the ‘C:\keil\TOOLS.INI’ file.
- Under the [C51] section, you will find the line:
TDRV0=BIN\MON51.DLL (“Keil Monitor-51 Driver”)
Immediately below it, add the line specifying the location of the DLL:
TDRV1 = BIN\VDM51.DLL (“Proteus VSM Monitor-51 Driver”)
- Save the ‘tools.ini’ file.
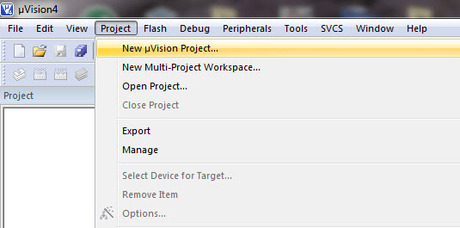
- Now, open the Keil IDE to create a new project.”
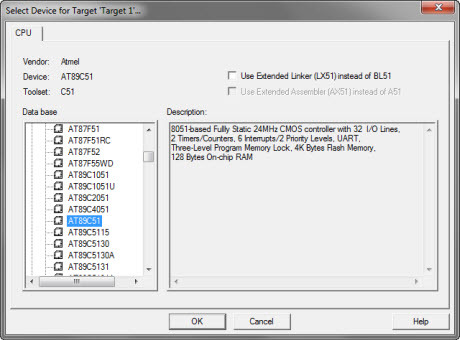
select the CPU AT89C51
the Source code is the following:
# define LEDS 6
# include “reg5 1. h”
unsigned char code Select [] = {0x0 1, 0x02, 0x04, 0x08, 0x1 0,0 x20};
unsigned char code LED_CODES [] =
{0xc0, 0xF9, 0xA4, 0xB0, 0x99, // 0-4
0x92, 0x82, 0xF8, 0x80, 0x90, // 5-9
0 x 8 8, 0 x 8 3, 0 x C 6, 0 x A 1, 0 x 8 6, // A, b, C, d, E
0x8E, 0xFF, 0x0C, 0x89, 0x7F, 0xBF // F, space , P, H,., -};
void main ()
{
char i = 0; long intj; while (1)
{P2 = 0;
P1 = LED_CODES ;
P2 = Select ;
for (j = 3000; j> 0; j –); // This LED models pulsed light , pulsed light by the //i-th bit , it will modify cycles , changing light delay before the next one , //get a different display.
i ++;
if (i> 5) i = 0;
}
}
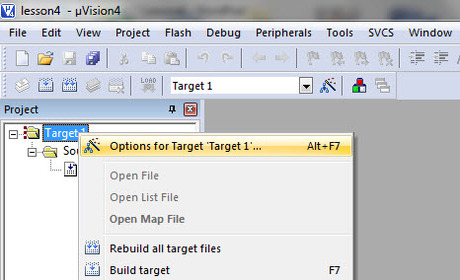
click the “Project menu/Options for Target” option
In the dialog box that appears, go to the ‘Debug’ tab and select ‘Proteus VSM Monitor-51 Driver,’ as shown in the image:
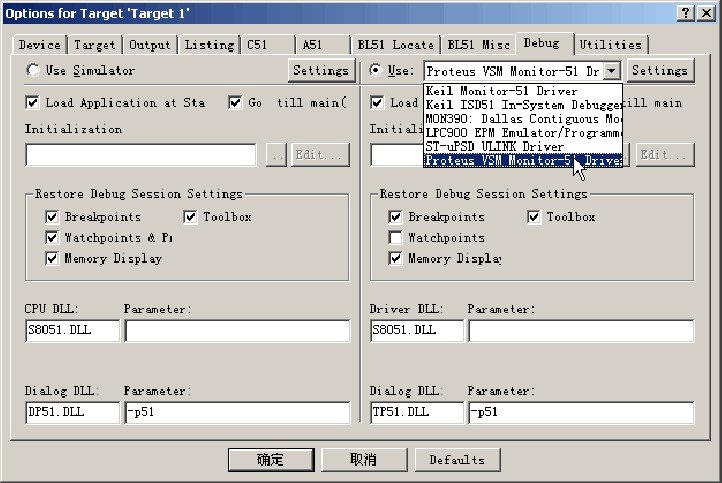
Click ‘Use,’ and then click the ‘Setting’ button to configure the communication interface. In the ‘Host’ field, enter ‘127.0.0.1,’ and in the ‘Port’ field, set the port number to ‘8000.’ Finally, compile the project.
Proteus settings
In Proteus, click the left mouse button on the ‘Debug’ menu and select ‘Use Remote Debugger Monitor,’ as shown below
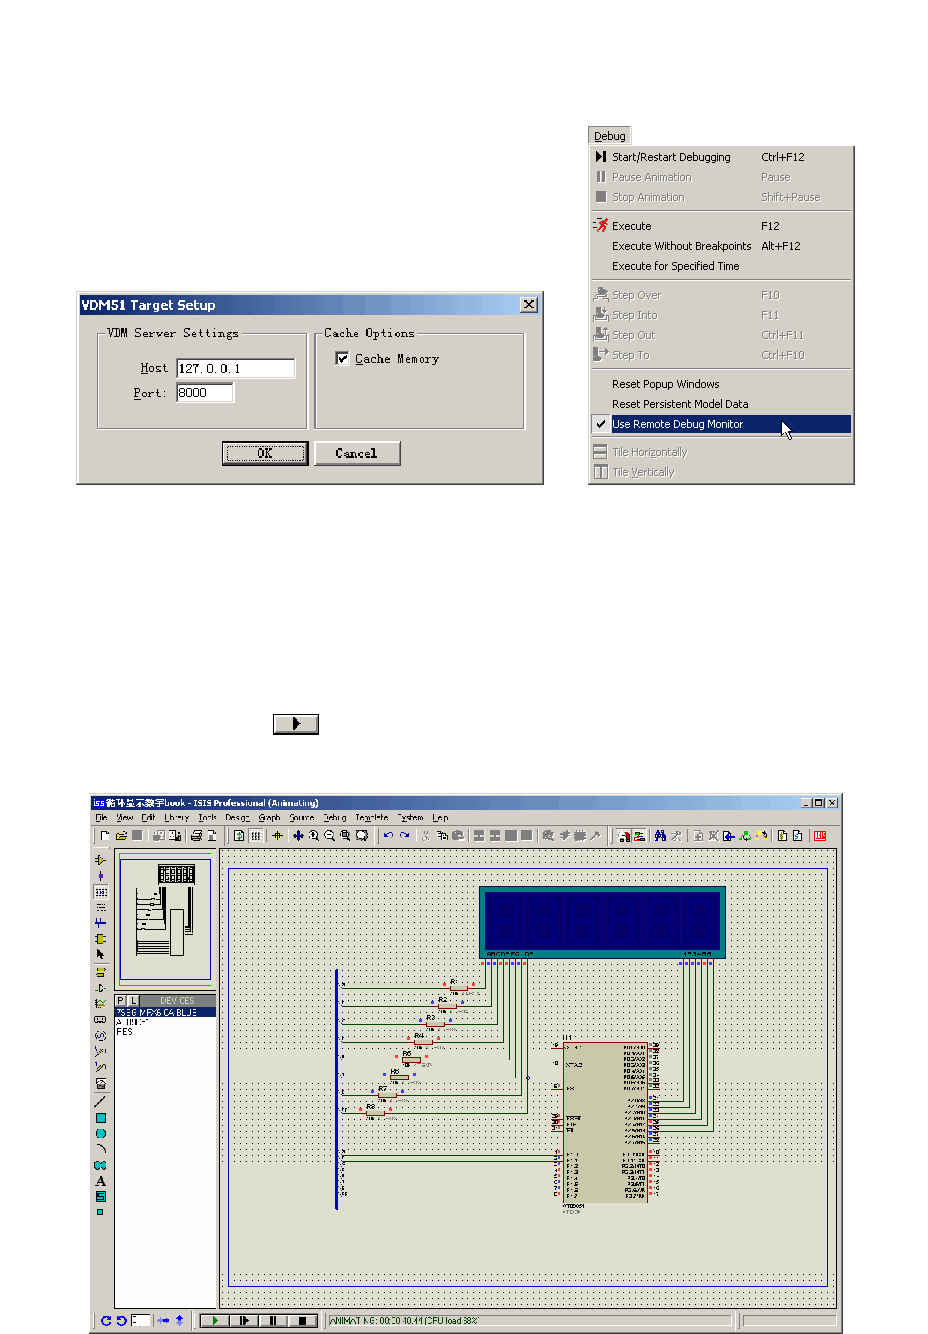
Click the ‘Start’ button to initiate the simulation. You can observe the frequency variation of each pin, with red indicating high-power frequency and blue representing low-frequency.

