After connecting all the components in the circuit, we achieve the following result:
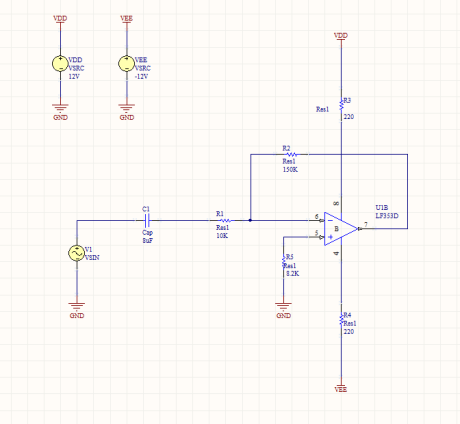
On the top toolbar click on the “Place Net Label” icon and label the INPUT and OUTPUT points in the circuit


Compiling a project verifies the design documents for drafting and electrical rules errors

By selecting “View, Toolbars, Mixed Sim” we can display the Mixed Sim Toolbar on the layout


Now let’s size the amplitude of sinusoidal source voltage setting to 0.1V and its frequency; right click on VSIN component, select “Properties…”, Models for V1-VSIN, “Edit…” button, Parameters Tab:

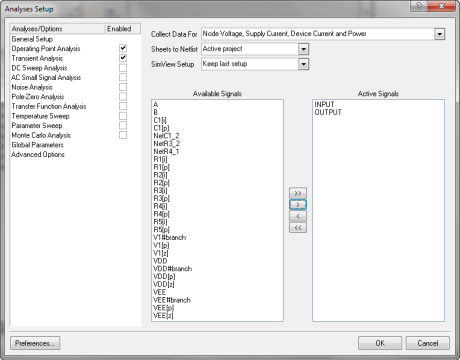
Click on “Setup Mixed-Signal Simulation” icon

On the “General Setup” select the points labeled as INPUT and OUTPUT
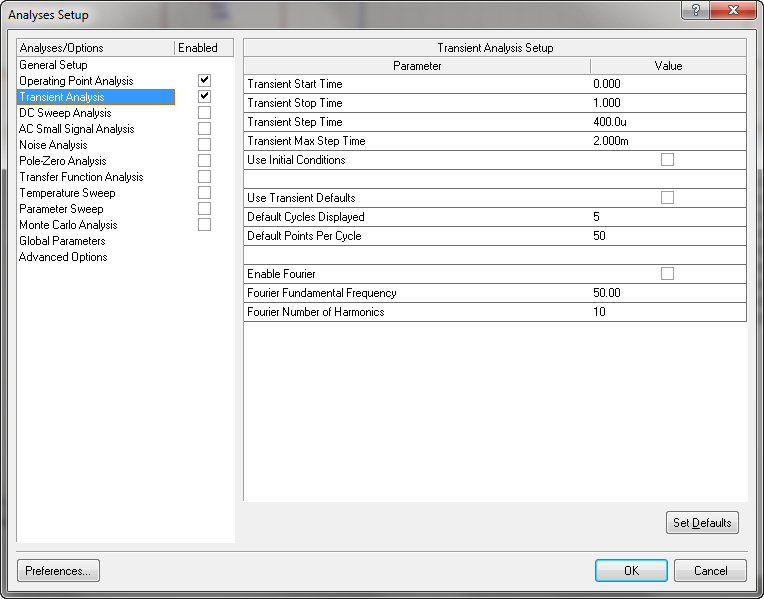
Set Transient Analysis Parameters and run the simulation
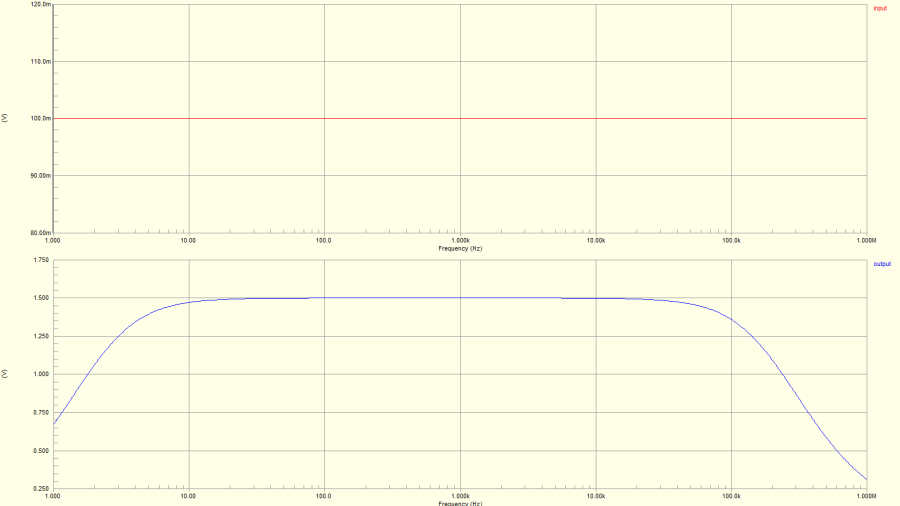
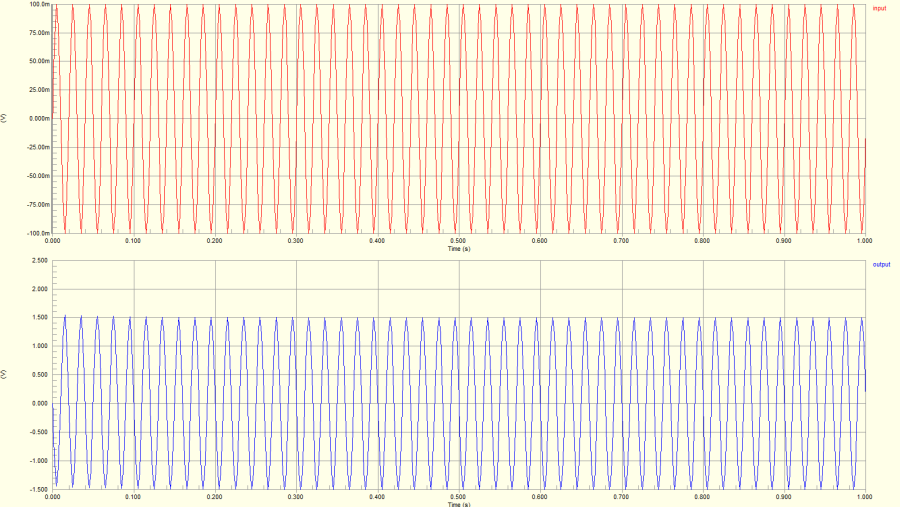
Here’s the graphical output of the transient simulation:
Similarly set the “AC Small Size Analysis” and run the simulation