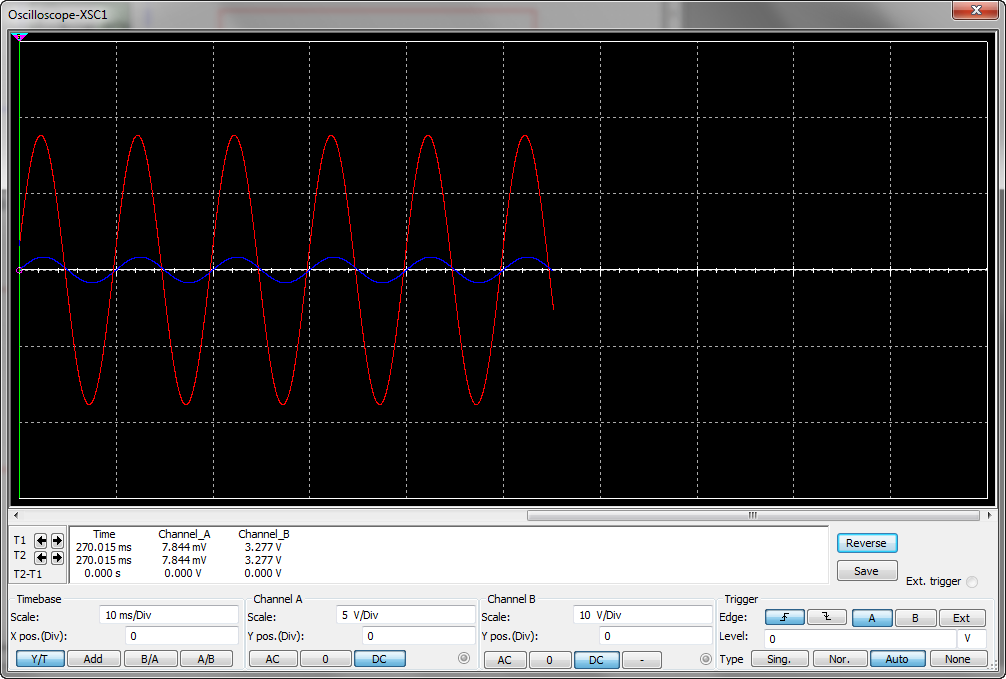
Now, proceed to perform a time transient analysis. Click on the ‘Run’ button located on the simulation toolbar, and then double-click on the oscilloscope to view the results
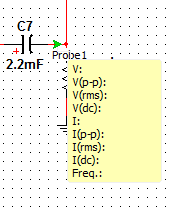
To perform an AC analysis, choose a Measurement Probe from the Instruments bar and place it on the output by left-clicking
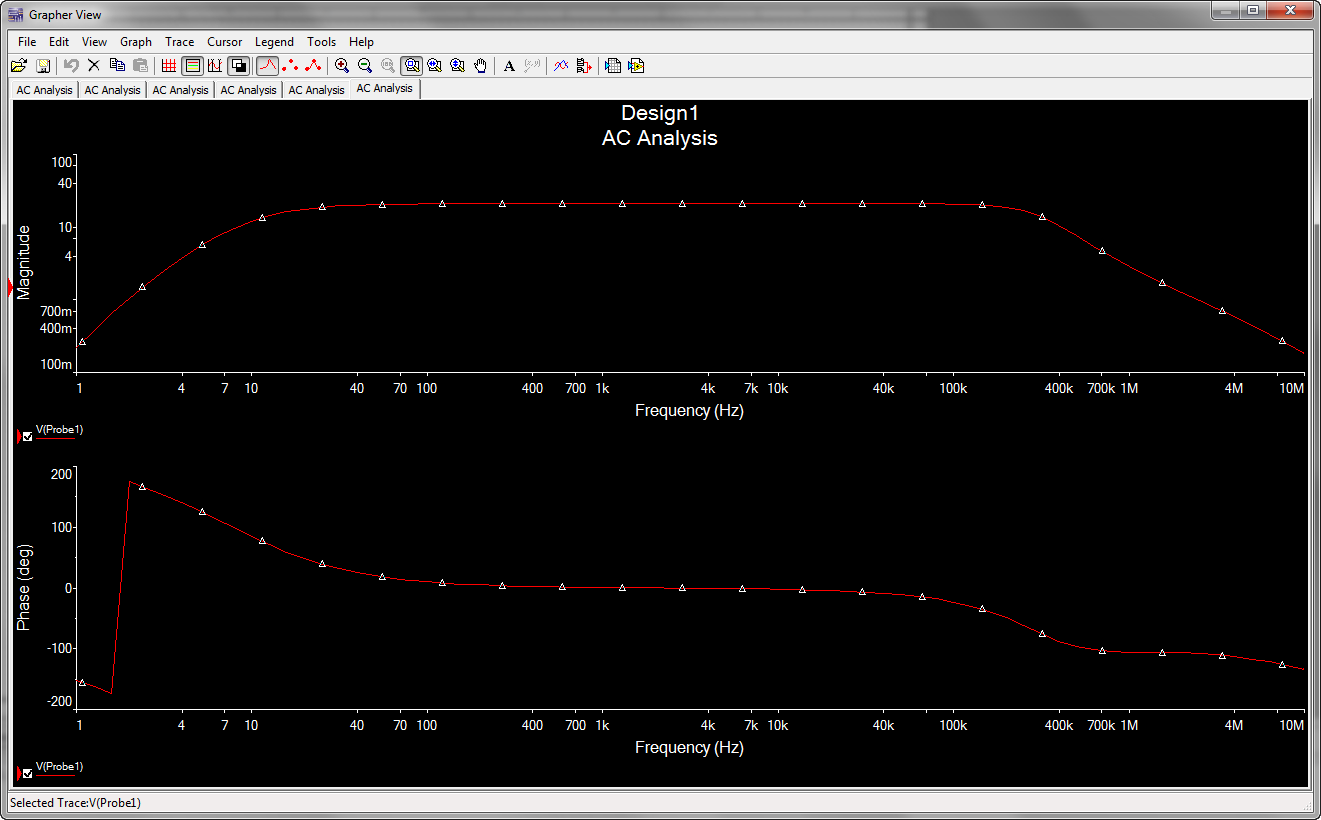
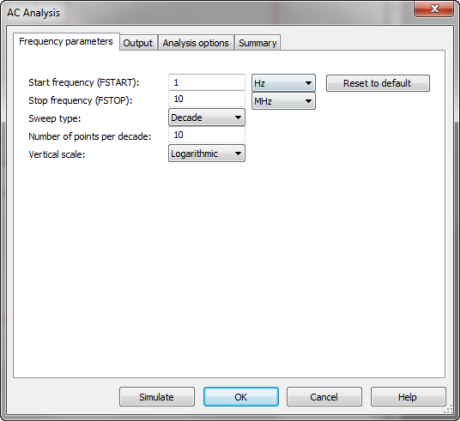
From the Grapher / Analysis List on the top bar, select AC Analysis…

Set the range of frequency
Add V(Probe 1) variable
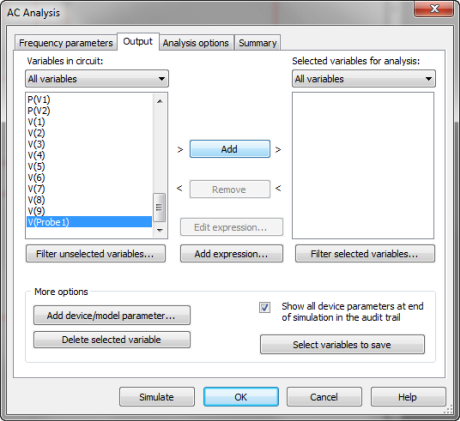
and now click the “Simulate” button: