Proteus is a comprehensive and highly regarded software platform widely employed in the field of electronics for its capabilities in electronic design and simulation. This versatile tool caters to a broad spectrum of users, including engineers, students, and electronics enthusiasts, offering a rich set of features that facilitate the development and testing of electronic circuits.
At the core of Proteus lies its robust simulation engine, which is instrumental in enabling users to emulate and test electronic designs with precision and efficiency. Proteus simulation provides users with the means to thoroughly assess the functionality and performance of their circuits, without the need for physical prototypes.
Proteus stands out for its capacity to simulate both digital and analog systems with ease. This means users can create intricate digital logic circuits, microcontroller-based projects, and complex analog circuits, all within a unified environment. This adaptability renders Proteus simulation a valuable tool for a broad spectrum of applications, from elementary LED circuits to advanced communication systems.
Moreover, Proteus simulation extends beyond mere static circuit analysis. It offers real-time interaction capabilities, particularly beneficial for projects involving microcontrollers and sensors. This functionality allows users to observe how their circuits respond to various inputs and stimuli. Running Proteus simulations translates into efficient resource utilization, as it mitigates the need for extensive physical prototyping and testing.
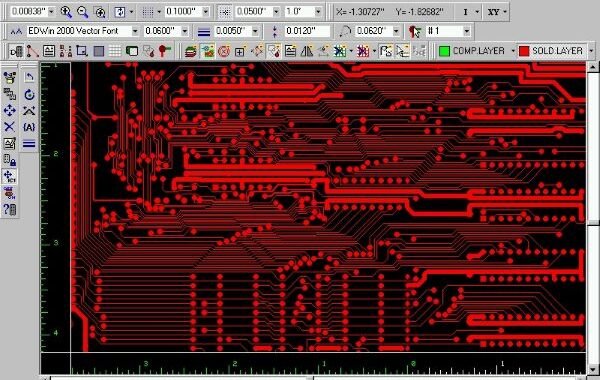
Proteus further complements its capabilities with a robust PCB (Printed Circuit Board) design module that seamlessly integrates with the simulation environment. This feature facilitates the design of PCB layouts based on circuit schematics, ensuring a seamless transition from concept to manufacturing. The ability to simulate the entire electronic system before progressing to PCB layout and fabrication is advantageous, as it facilitates the early detection and resolution of potential issues, thereby saving both time and resources.
In this article, we will introduce you to the world of Proteus simulation and guide you through the initial steps of harnessing its power, drawing a circuit within the “Schematic Capture” design environment. We’ll walk you through a step-by-step tutorial, showcasing how to interface a microcontroller with an LCD display, allowing you to gain practical experience while using Proteus to bring your electronic designs to life.
In addition, within this article, we will also delve into the graphical modification of existing components and explore the use of Subcircuits to streamline our circuit designs, enhancing our efficiency in Proteus simulation.
To expand the SPICE model library and learn how to import PSPice models into Proteus, please refer to this article.
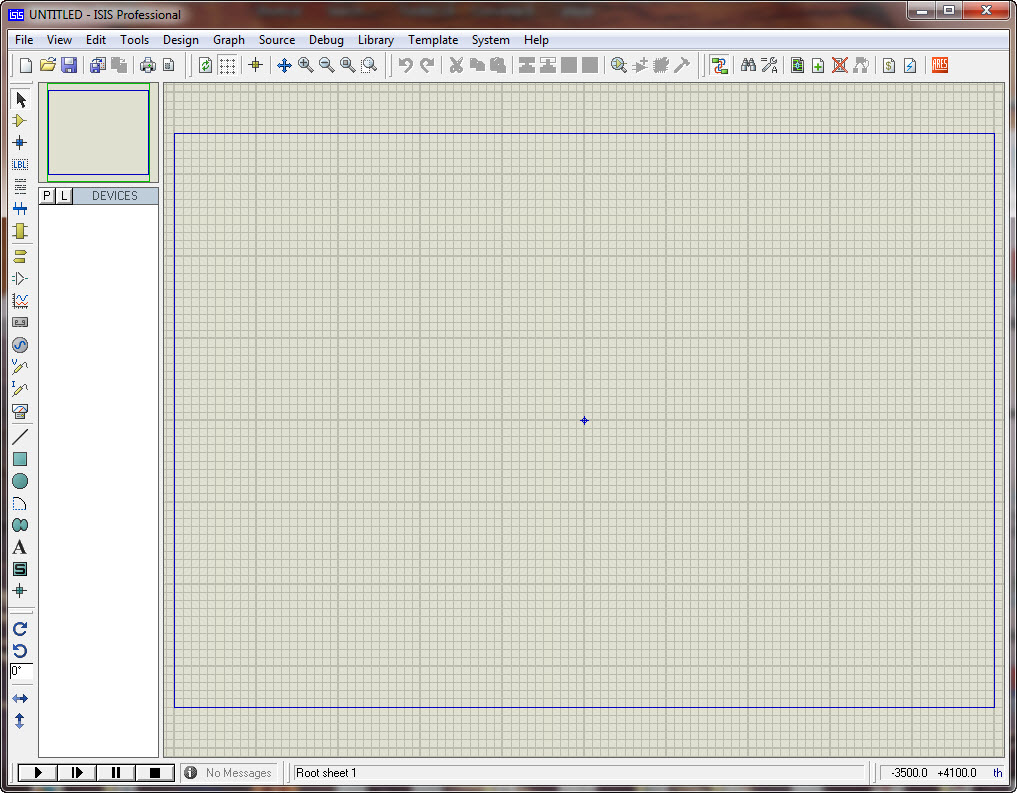
After installing Proteus, run Proteus Professional; the following window interface will appear:
The following is a brief description of each part of the window interface:
1. Schematic Editor window (The Editing Window):
As the name implies, this window is used for drawing schematics. The blue box serves as the editable area where components can be placed. Please note that this window does not have a scroll bar; you can utilize the preview window to adjust the schematic’s visual range.
2. Preview window (The Overview Window):
This window serves two purposes. Firstly, when you are in the component list and select a component, it provides a preview of the chosen element. Secondly, when your mouse focus is on the main schematic editor window (i.e., when you place a component into the schematic editor window or after opening the Schematic Editor window, simply clicking the mouse), it displays a thumbnail view of the entire schematic diagram. Additionally, it highlights a green box within this thumbnail, representing the content currently visible in the main schematic window. By clicking on this green box with the mouse, you can alter its position, consequently adjusting the schematic’s visual range.
3. Model Selection Toolbar (Mode Selector Toolbar):
Main Modes:
in order from left to right let’s see what the various icons represent:
1 * Select elements (components) ( selected by default )
2 * Place the connection point
3 * place a label ( the bus will be used )
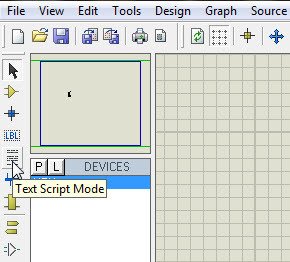
4 * Place text
5 * for drawing bus
6 * for placing subcircuits
7 * for instant editing component parameters ( first click on the icon and then click the element you want to modify )
Tools:
1 * terminal interface (terminals): There VCC, ground , output, input and other interfaces
2 * Device Pin : for drawing pin
3 * Emulation chart (graph): used for various analyzes, such as Noise Analysis
4 * recorder
5 * signal generator (generators)
6 * Voltage Probe: to be used when using simulation charts
7 * current probe : Using simulation to be used when using simulation charts
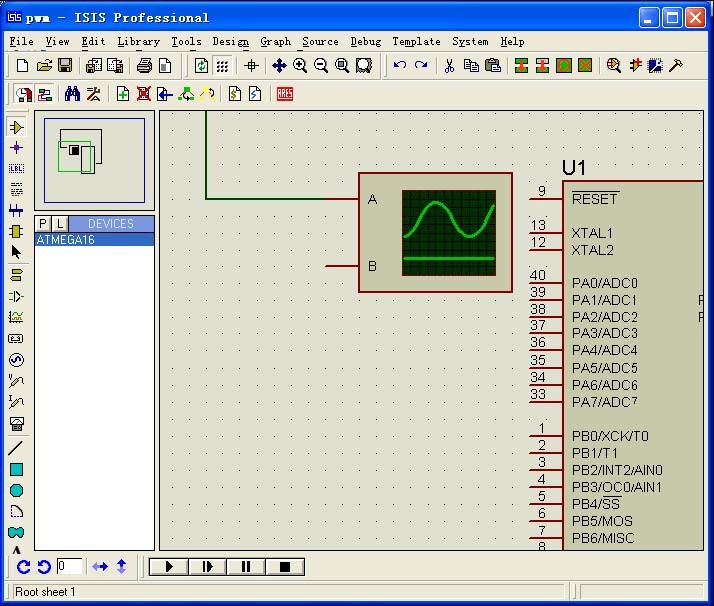
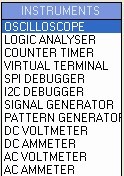
8 * Virtual Instrument : in the image above, an oscilloscope
2D graphics (2D Graphics):
1 * Drawing Lines
2 * draw a variety of boxes
3 * draw various circles
4 * draw a variety of arc
5 * draw various polygons
6 * draw various text
7 * draw symbols
8 * paintings origin , etc.
4 . Component List (The Object Selector):
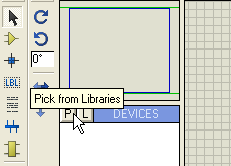
For the selection of components (components), terminal interface (terminals), the signal generator (Generators), simulation chart (graph) and so on. For example , when you select ” Component (Components) “, click the ” P ” button will open the selected component dialog box, select an element after ( click on the ” OK ” after ) , the device will be displayed in the list of elements , later to use this element, just in the component list can be.
5 . Toolbars direction (Orientation Toolbar):
Rotate :
The rotation angle can be an integer multiple of 90 .
Flip:
Flip Horizontal and vertical flip finish . Use: Right-click the component , and then click ( left-click ) the corresponding rotation icon.
6 . Simulation Toolbar
1 * Run
2 * single-step operation
3 * Pause
4 * Stop
AVR microcontroller simulation example:
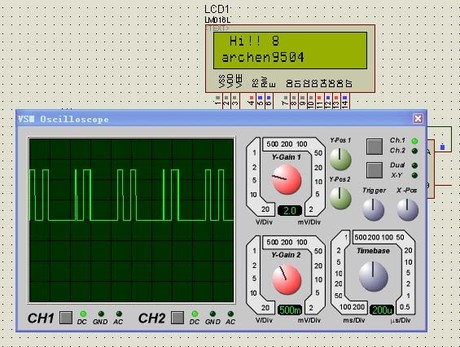
We aim to design an AVR driver for an LCD1602 and monitor its data lines using an oscilloscope. It’s worth noting that various compilers generate different file formats. For instance, ICC produces COF files, IAR generates D90 files, and GCC outputs COF and ELF formats. Fortunately, Proteus supports multiple file formats including COF, D90, HEX, and more, making it a versatile platform for our project.
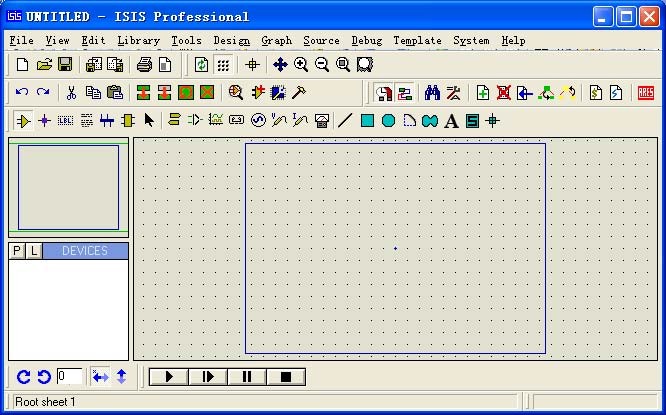
When you launch Proteus Professional, the following window will appear:
1, Add the components:
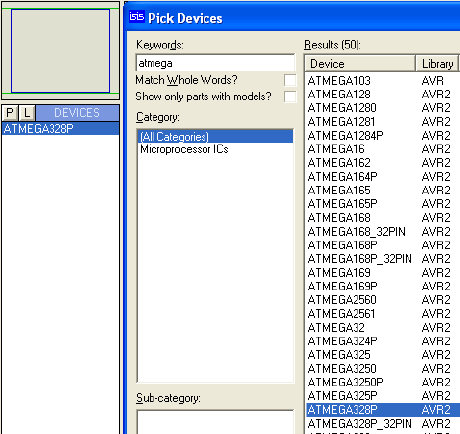
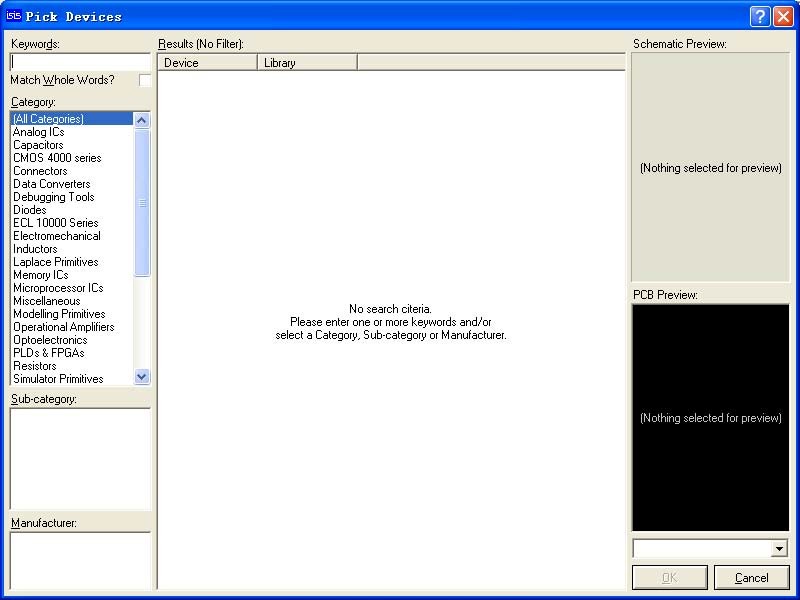
in this case, the ATMEGA16 and LM016L (LCD1602). Afterward, we will add the oscilloscope. Click the “P” button to open the Component dialog box.
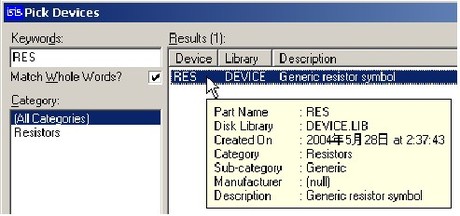
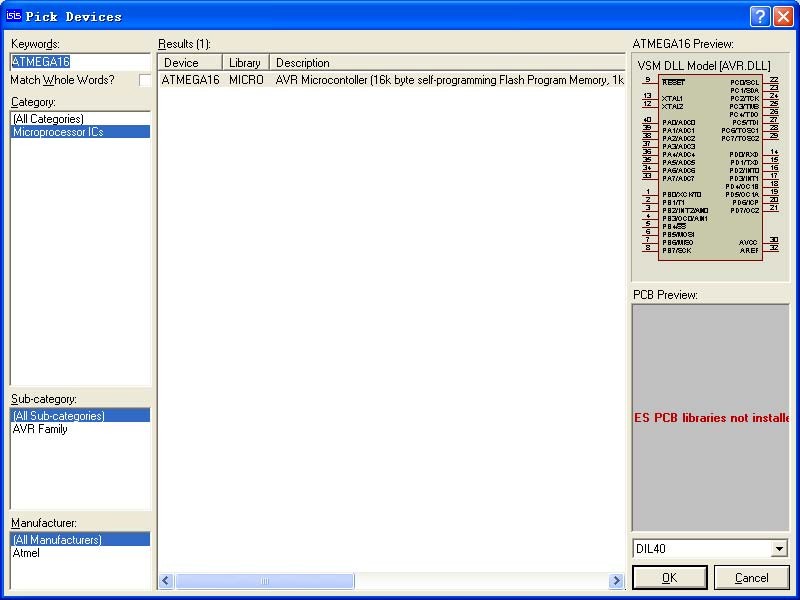
Entering “ATMEGA16” inside the “Keywords” field of the dialog box will yield the following results:
Click “OK” and close the dialog box. Afterward, you will find the components listed in the component list, including ATMEGA16 and LM016L. This concludes the process.
2 Place the components:
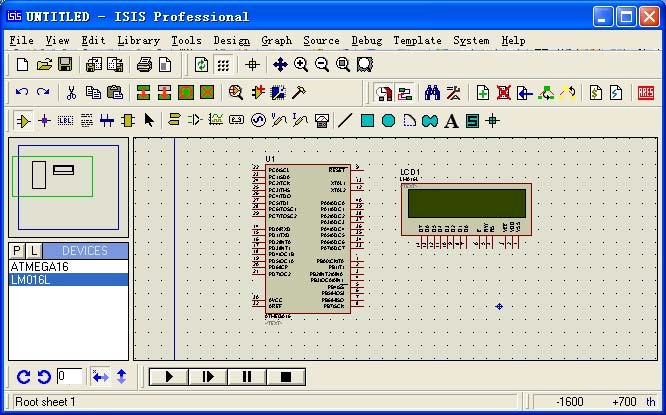
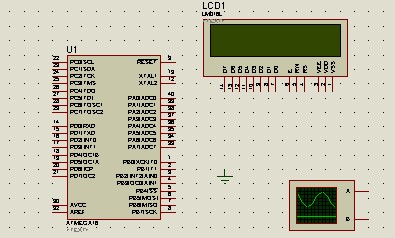
In the component list, select “ATMEGA16,” and then in the schematic editor window, left-click to place ATMEGA16 in the Schematic Editor window. Follow the same procedure to place LM016L as well.
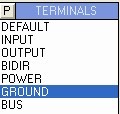
Click on the ‘terminal interface’ icon, select ‘Ground’ to place the ground reference on the drawing.
left-click to place the “ground” symbol into the Schematic Editor window.
Click on the ‘Virtual Instrument’ icon and select ‘oscilloscope’:
left-click to place the oscilloscope symbol into the Schematic Editor window:
Place the components, making sure to position them inside the blue workarea box.
3 . Connection
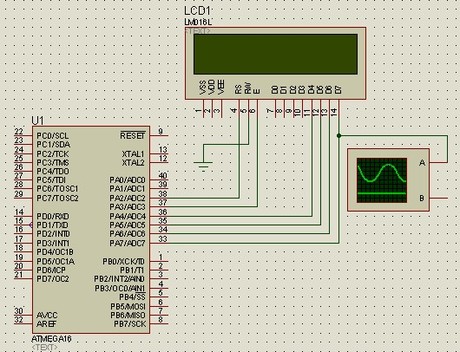
The terminals of the LCD, VSS, VDD, and VEE do not need connections; they are by default: VSS = 0V, VDD = 5V, VEE =-5V, GND = 0V. Connect the RS, RW, and E terminals, as well as the terminals from D4 to D7, as shown in the picture below.
4 . Add a simulation file.
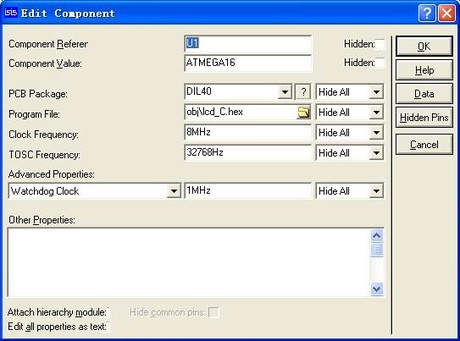
Right-click on ATMEGA16 first, then select ‘Edit Properties.
In the Program File field, click on the File Browser dialog box, locate the ‘lcd_C.hex’ file, click OK to complete the file addition. Set the Clock Frequency to 8MHz, and click OK to exit
5 . Simulation
Click Start simulation :
Description: The red color of the LCD terminal indicates a high voltage level, while blue represents a low voltage level., gray represents uncertainty level (floating). By running the Debug menu, you can view AVR-related resources.
6 the source code debugging
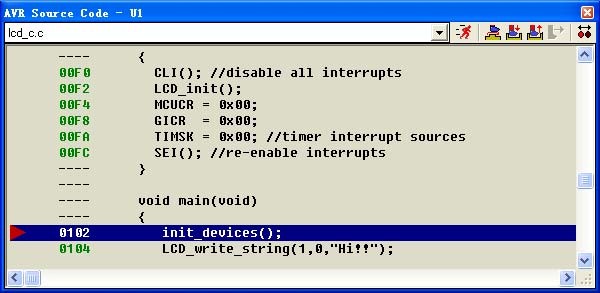
Proteus supports COF file debugging. Make sure to generate this file in your compiler options. Finish the schematic drawing and add the debug files (COF file), then click the icon below:
The AVR Source Code window will appear. If it doesn’t appear in the debugger, navigate to the Debug menu to locate it.
Let’s discuss these icons:
1 * continuous operation , it will exit the single-step debug state , and close the AVR Source Code window
2 * single-step operation , skip directly encountered Functions
3 * single-step operation , will enter its internal encountered Functions
4 * out of the current function , when using 3 * into the internal function , use it immediately on exiting the function returns a function , it should be seen in conjunction with the 3 *
5 * run to the line where is the mouse
6 * Add or remove a breakpoint , the breakpoint is set using the program will stop at the breakpoint.


